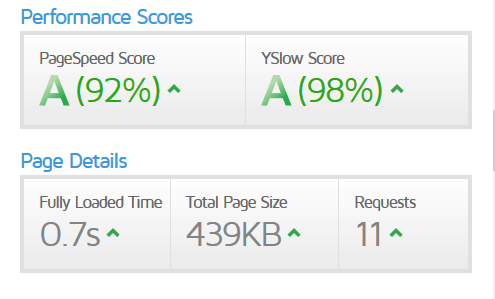
WordPress improved performance example

Webpage performance is all about the perception of performance.
Today, I played around with native image lazy loading (`loading=”lazy”` image attribute).
Now, I could make a blog post on my site out of this, but I think you’re more interested as a part of the WordPress Speed Up group.
If you need speed load help with WordPress click the link.
The speed tests
I tested this with GTMetrix via Vancouver, 4,788 miles from the server (which is in Amsterdam). That’s a long trip, so you can easily capture how pages are loading in sub-optimal conditions.
Lazy versus without lazy
With lazy loading (onload: 2.1s) https://gtmetrix.com/reports/theseoframework.com/SJmuAHeT#video
Without lazy loading (onload: 0.9s) https://gtmetrix.com/reports/theseoframework.com/HFACzyIK#video
As you can see, the images load after the styles when lazy loading is enabled. But, the images load before the styles when lazy loading is disabled.
I wasn’t entirely convinced with the results. So, I tested again from Sydney (10,350 miles from the server!). And, the results are surprising.
Without lazy loading via Sydney (onload: 3.6s) https://gtmetrix.com/reports/theseoframework.com/fgFi9Uux#video
Funnily enough, when testing from literally the other side of the world, without lazy loading, the images again load after the styles are loaded.
Conclusion
The native lazy loading feature adds nothing beneficial the browser wouldn’t do automatically already. I don’t recommend implementing it; but, more tests are welcomed.
Bonus: We don’t use caching plugins.
If you’re interested, here’s how I achieved these amazing load times without caching plugins. Spoiler alert: DIY.
TTFB: I manually optimized the Apache server for quick SSL-negotiation and response times.
For example, the server is using Zend Opcache via PHP-FPM, this runs in memory (unlike Siteground, which runs on disk). As a developer, I created almost all plugins and the child theme for the website.
In Europe, the site achieves complete load times under a second (source: https://gtmetrix.com/reports/theseoframework.com/jzf6CLoq).
Using HTTP/3 will likely bring this number down a lot more.Yes, Apache. As long as you don’t serve static content, WordPress works better on Apache.
NGINX requires an Apache-based FastCGI proxy to serve your pages, which isn’t optimal. Even better would be to use (Open)LiteSpeed with LSCache, which gives you the best of both worlds. Most sites don’t have the luxury to optimize for Apache, which is why NGINX often performs so much better.
First paint: The site outputs the background, typographic, and header styles via inline CSS. This gives the impression the site is already received and being processed, without having any critical external resources yet. This is a big win if you want to improve the perceived performance and lower the bounce-rate.
No external scripts are loaded yet at this point, but the site already started preloading all critical CSS and scripts via respective meta tags. The files are sent via an NGINX-powered Azure pull-CDN (“Premium Verizon” with custom rules).
Pro tip: Don’t use Push-CDNs, WordPress isn’t compatible with those out of the box, and the supporting plugins that enable compatibility require a lot of maintenance and tweaking. Always use Pull-CDNs with WordPress for a hassle-free no-maintenance operation.
First contentful paint: Here’s where the browser starts using the external styles. The browser paints again for the final look.
With lazy loading: The browser doesn’t even consider painting the images yet, and waits for the full CSS paint to determine the position of the images (before loading them in).
Without lazy loading: The browser considers loading and painting the images already. I can’t tell what algorithms are used to determine this, but they probably read the performance numbers in real-time.
DOM loaded: Here’s where the browser finished using the external scripts and images.
With lazy loading: Finally, thanks to the native lazy loading (loading=”lazy” attribute), the images are loaded.
Without lazy loading: For this page, nothing happens here.
Onload: The favicon is loaded, but nothing else happens here.
Fully loaded: We’re done!
All in all, the page was actionable in 0.8 seconds from Vancouver, which is a very long distance, and that without caching plugins.
The data from GTMetrix is tremendously helpful, but you need to be critical of the results. It takes a lot of time and experience to make the results actionable. Keep at it!
As another bonus, here are the results from Google Pagespeed Insights.
Yes, 100/100 is possible: https://developers.google.com/speed/pagespeed/insights/?url=https%3A%2F%2Ftheseoframework.com%2Fcategory%2Fblog%2F&tab=desktop
To close, you don’t see my face around here often because I’m always working on other things, but I do love reading your topics whenever I find the time. Thank you!


